Who is responsible for all the salt on the ground?

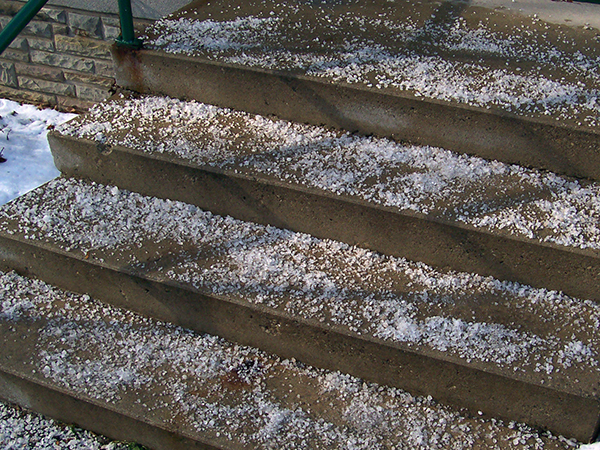
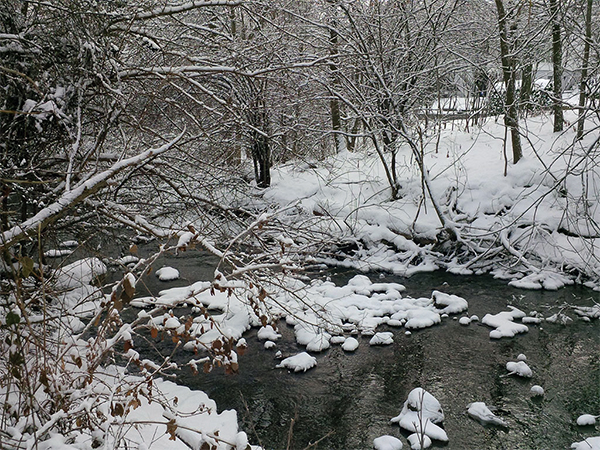
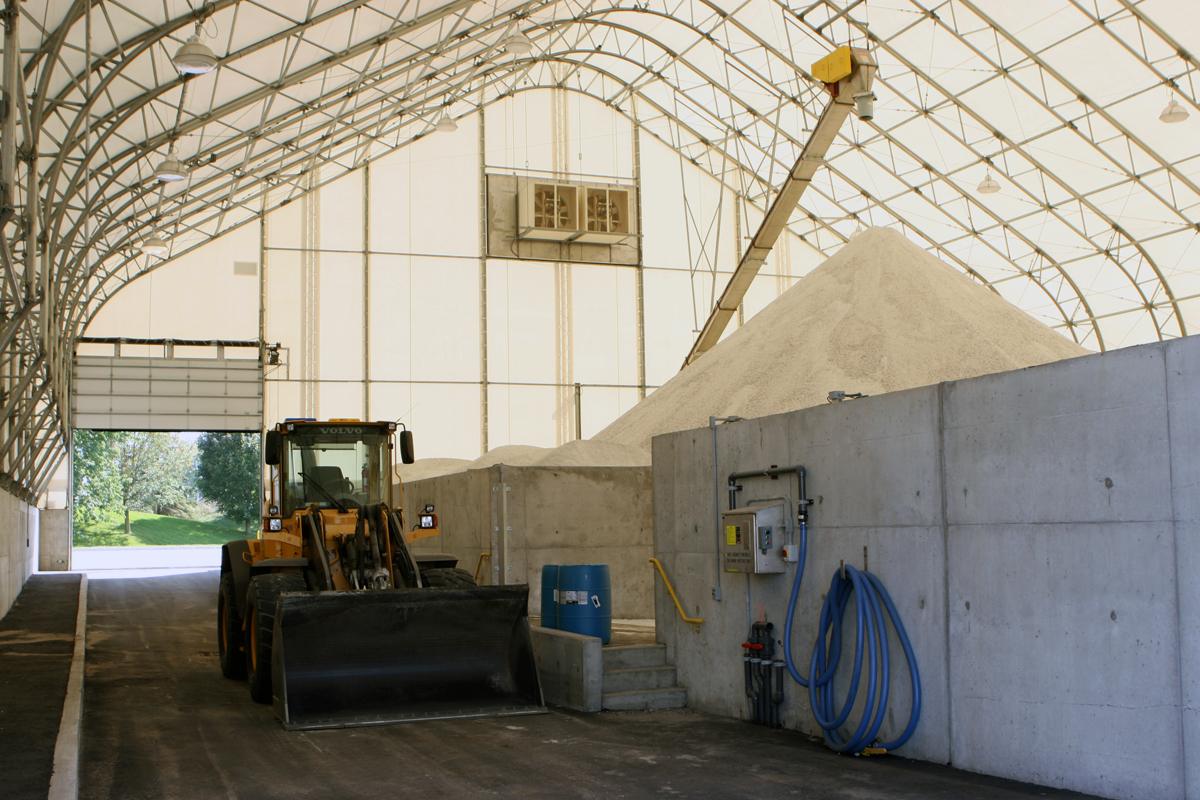
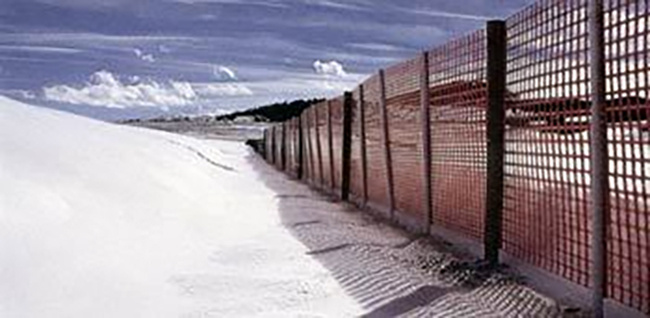
From where I’m looking there seems to be a love-hate relationship with salt. Sure it is bad for me, groundwater – your drinking water. But when it’s time to deal with snow and ice, there isn’t anything else that works quite like salt.

Have you ever thought about how much of your community is paved? There are the roads, community trails, sidewalks, driveways and parking lots. During the winter, all these areas need to be kept clear of snow and ice for both accessibility and safety.

Figure 1 – Many communities include a lot of paved areas that require salting in the winter. Aerial view of Waterloo Region.

When it comes to the environmental impacts of salt, the tendency is to point the finger at other people and groups. They are the reason so much salt is spread.

What if I told you everyone, to some degree, contributes to the problem but can also be part of the solution. How can that be? You might be thinking “I don’t use much, if any salt” or “I only use such a small amount compared to others”.

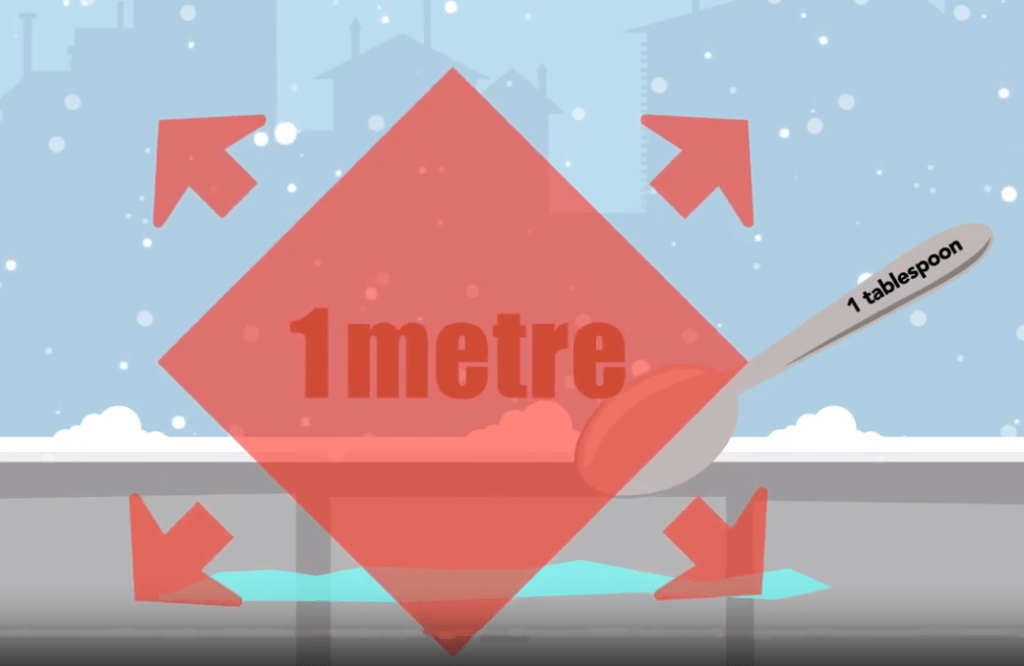
That might be so but let’s think about why salt is used. Sure it makes removing snow and ice that much easier by lowering the freezing point when water in its liquid form changes to ice. That’s more of a technical answer but the reasons go much deeper making it a complex problem to solve.

Here are a few of those reasons why so much salt is spread.

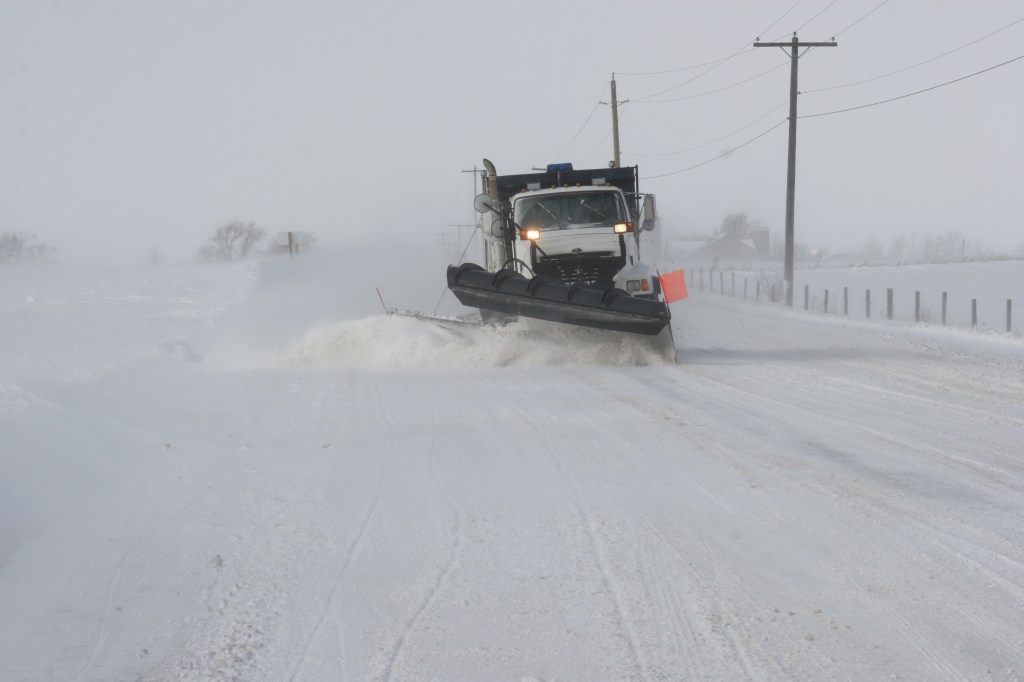
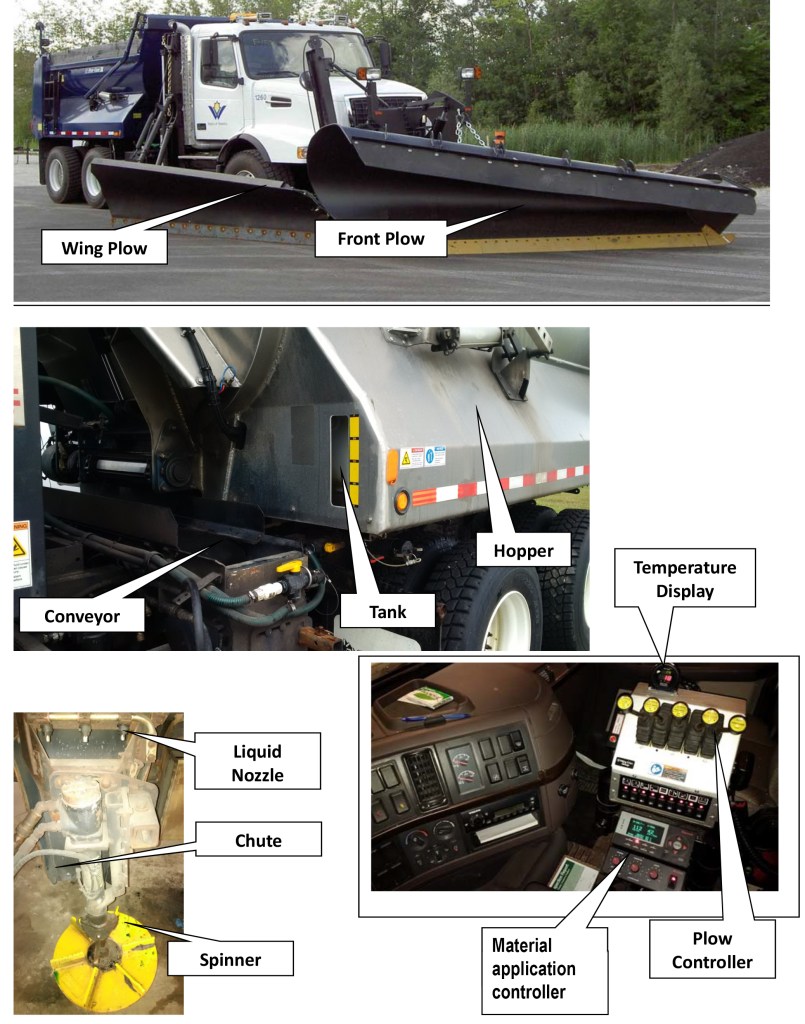
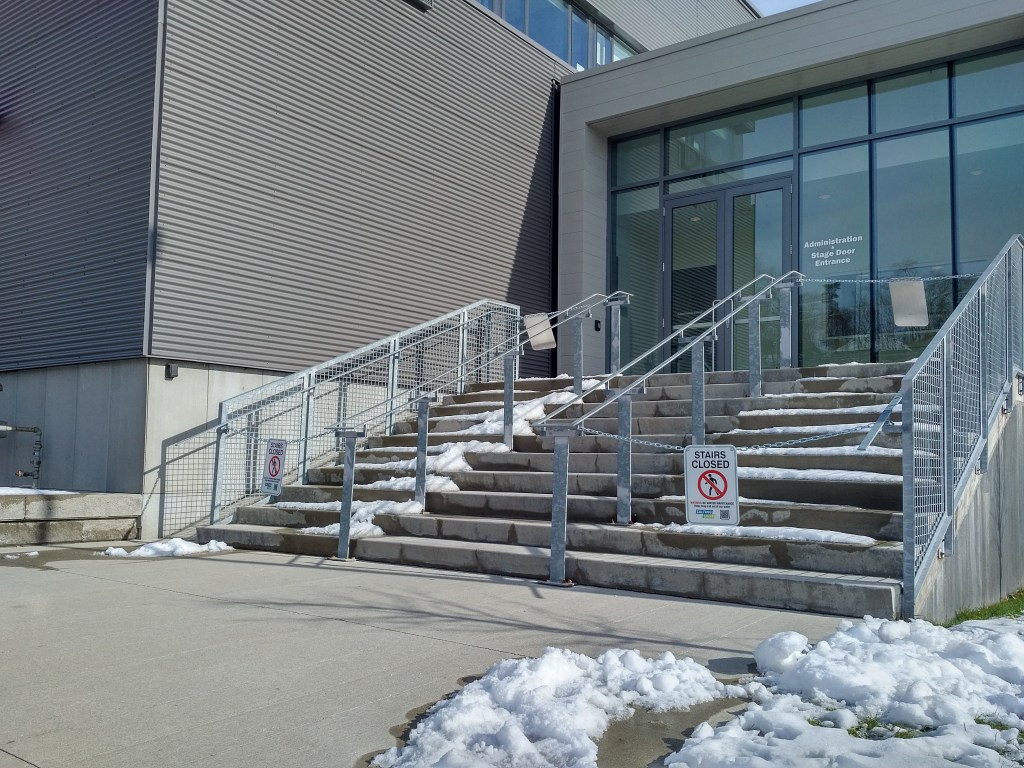
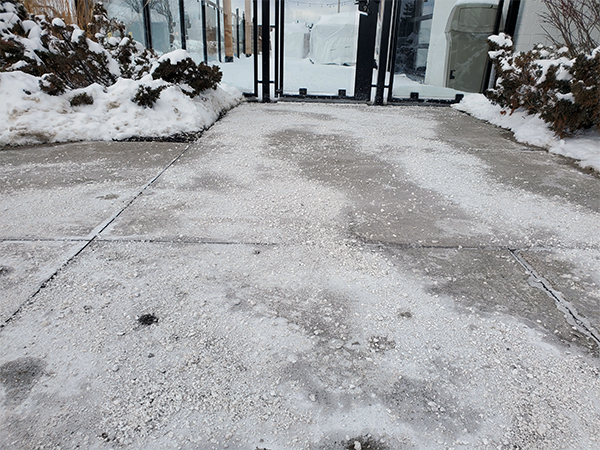
  1. Liability. The fear of being sued is one of the biggest reasons businesses spread so much salt. Too much is used and it’s spread even when it’s not needed or when it’s too cold for the salt to be effective.
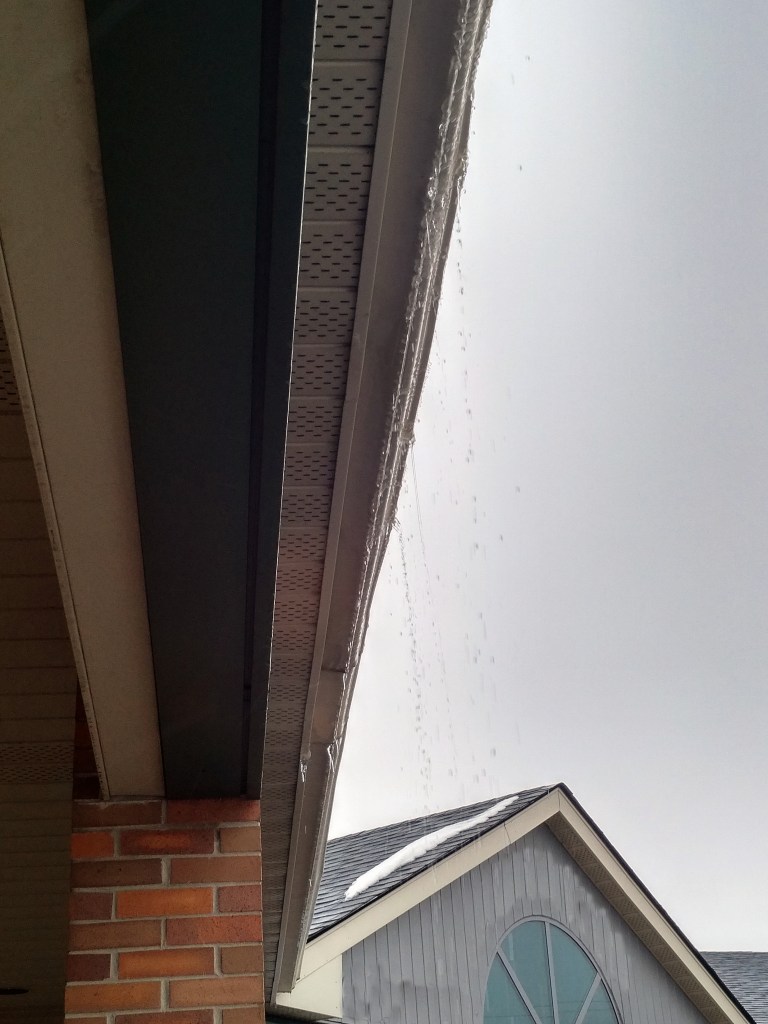
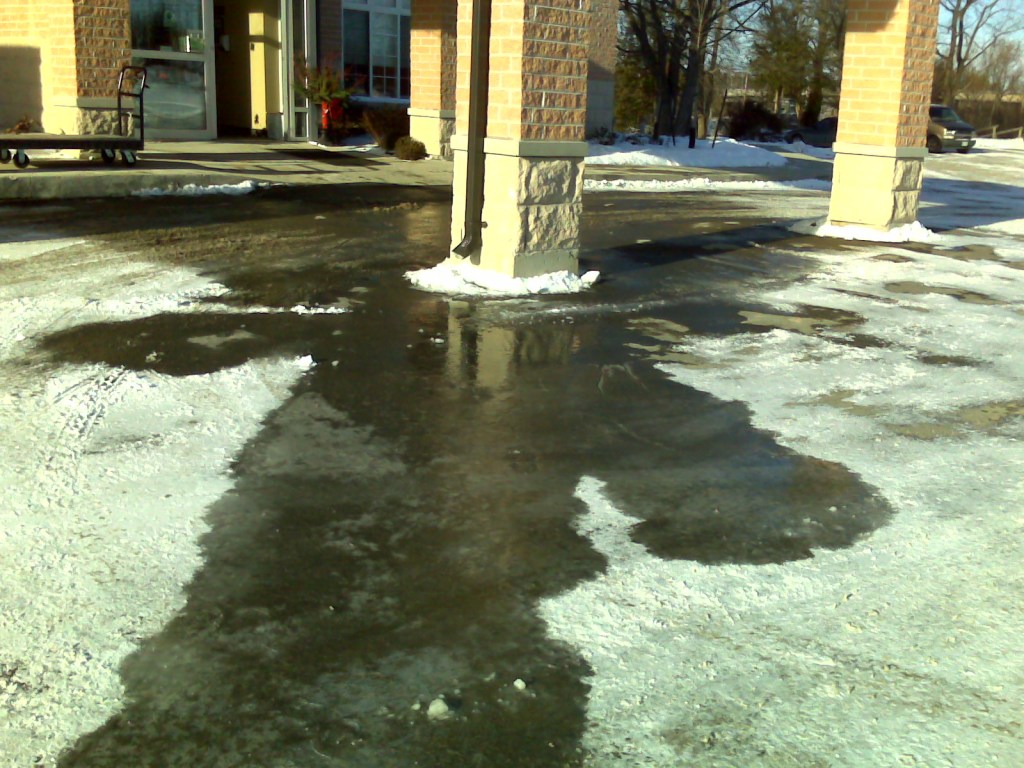
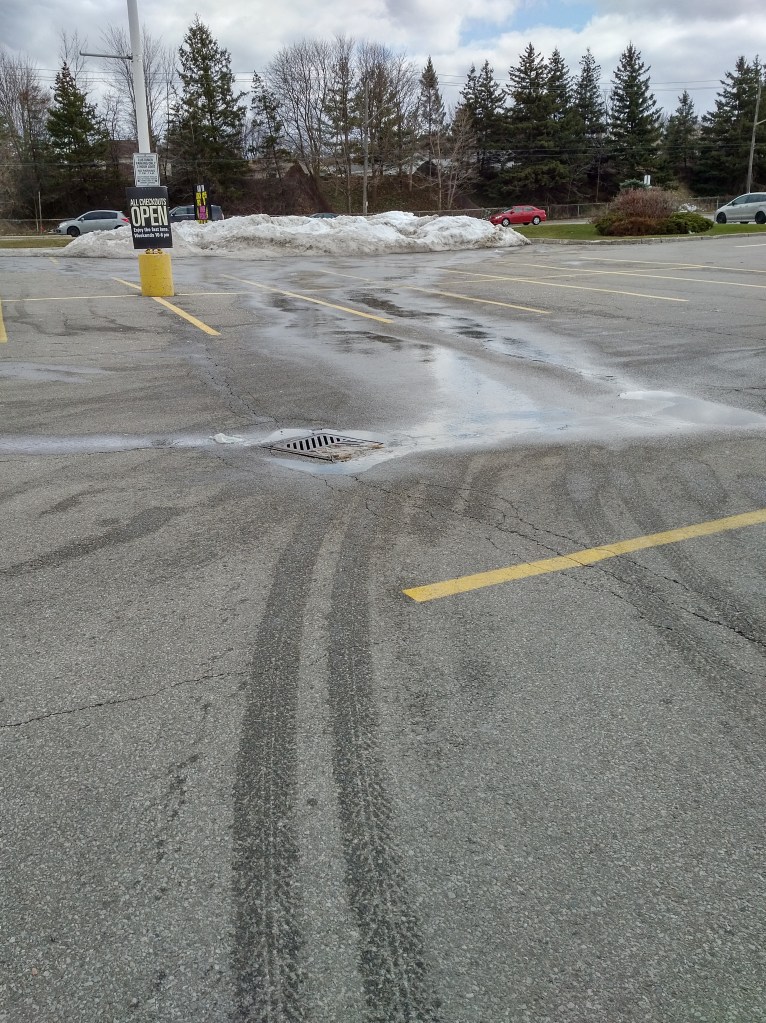
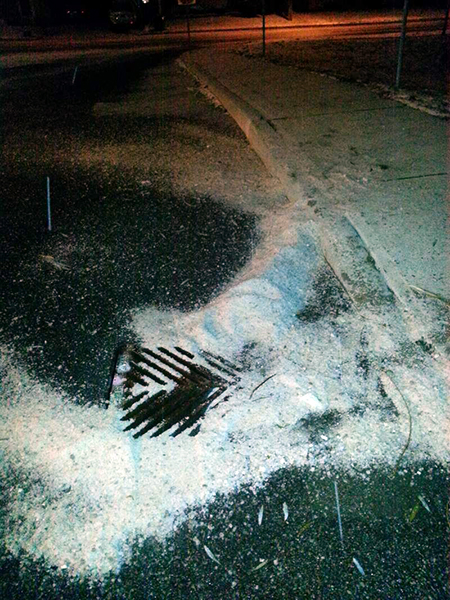
  2. Salt means safety. When you go for a walk or drive and see salt, it can make you feel safe. You know the property owner is doing their part to clear the snow and ice. But what if you don’t see salt on the ground. Does that mean it isn’t safe? Should you demand the property spread more salt? Maybe there isn’t any ice and salt isn’t necessary. Maybe salt isn’t the right tool for the current weather conditions. Or maybe the right amount of salt has already been put down and has turned into a liquid brine that – even though you can’t see it – is still hard at work. Whatever the reason, salt is not always the right or only tool for dealing with snow and ice. And not seeing salt on the ground doesn’t necessarily mean it is less safe.
sidewalk with too much salt
Figure 2 – Does more salt make you feel safer?

3. Expectations. It’s winter. You are going to have to deal with snow and ice at some point. Yet there is an expectation to be able to travel the same as if it was summer. For this to be a reality can mean more salt spread to speed up the melting process. Is there a way to balance expectations for clear passage while still protecting me – your drinking water – from the damaging impacts of salt?

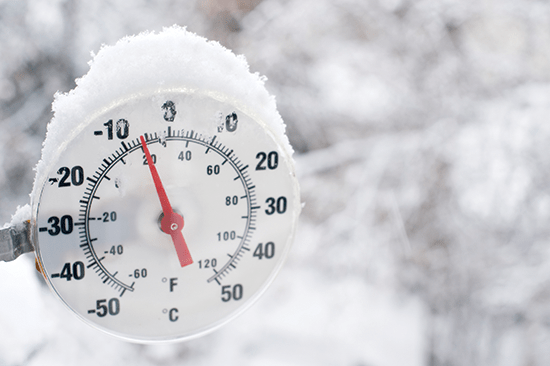
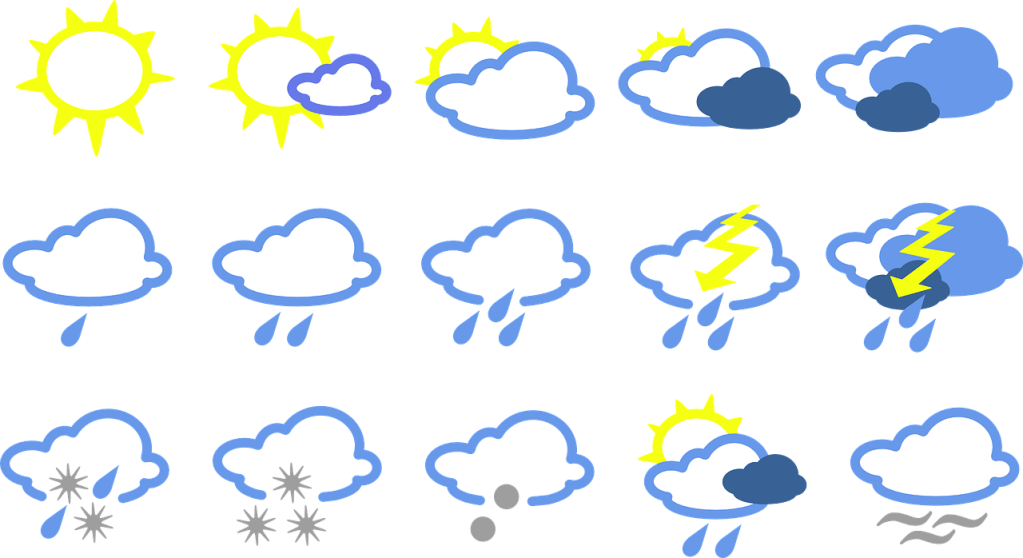
4. Changing weather. In Southern Ontario, winter can mean snow, freezing rain, rain, warm temperatures, or really cold temperatures. You get where I’m going with this. As weather patterns change, meeting expectations to keep areas clear of snow and ice can be a challenge and might include the spreading of more salt to meet expectations of clear pavement all of the time.

5. Personal safety. Wearing winter boots and switching to winter tires can seem like an inconvenience and an unnecessary expense. But living where there’s snow and ice should include taking these preventative steps to protect yourself. This also means giving yourself extra time to get to your destination and driving, biking or walking for the current weather conditions.

Video: Walk Like a Penguin (Alberta Health Services)

Not everyone uses salt but everyone at some point uses the surfaces that are salted. Changing actions and expectations over time might help support the responsible use of salt required to better protect the environment including me, groundwater – your drinking water, because – well – I think I’m worth protecting.

Cheers, Groundwater

Related posts:

A look back in time – Kitchener’s first drinking water system

If you’re a history buff, or even if you’re not and would like to learn more about Waterloo Region’s past, then this post is for you! Our story begins in the town of Berlin, Ontario. Haven’t heard of Berlin? If you live in Waterloo Region, you most likely have been there. You see, Berlin today is Kitchener.

Berlin’s beginnings start in the early 1800s and quickly becomes a thriving community. Between 1881 and 1891, Berlin’s population grew by 83 per cent. The blog Rye & Ginger: Berlin, Ontario until 1916, tells how “By the 1850s, the growing town became the County Seat. Its political and economic influence grew, helped by the arrival of the Grand Trunk Railway.”

Let’s fast forward to 1888. A water system that includes fire protection becomes a growing interest for the community. To address this need, the Berlin Waterworks Company – privately owned by Moffet, Hodgins and Clarke – constructs the first water supply plant to serve this thriving and growing town. The plant is built near the water source – Shoemaker Pond.

The site is located at what is now known as Lakeside Park near where the Greenbrook Water Treatment Plant now operates at 20 Greenbrook Drive in Kitchener. Today, the area looks much different surrounded by residential homes. In 1888, the location is in the country with no homes in site. Today, if you look closely, remnants of the water supply plant foundation can still be found off the path that connects the Greenbrook Water Treatment Plant parking lot with Queen’s Blvd.

Location of the first water supply plant (figures 1 to 3)

Google map of 20 Greenbrook Drive in Kitchener showing Lakeside Park.
Figure 1: Starting at the Greenbrook Water Treatment Plant, follow the path keeping Shoemaker Pond on your right until you reach the location circled on the map. Credit: Google Maps
Photo of Lakeside Park path showing location of foundation for original water supply plant.
Figure 2: Walking up the path with Shoemaker Pond on your right you will come across a flower bed on the left side of the path.
Close up look at original foundation of the water supply plant.
Figure 3: Upon closer inspection of the flower bed closest to the path you might see part of the foundation for the water supply plant built in 1888.

From 1888 to 1899, the water supply plant provides water from Shoemaker Pond to the residents of Berlin. I’m sure you can imagine what the water quality from the pond might look, smell and taste like – especially during the summer months. Public dissatisfaction with the supply persuades the citizens of Berlin to vote for a municipal water works, a very innovative idea for that time. In 1898, the Berlin Water Commission purchases the plant and takes over the responsibility of supplying water to the town.

Drawing of the water supply plant built in 1888.
Figure 4 – 1888: drawing of water supply plant in Berlin.
photo of persons at a groundwater well in front of the water supply plant in Berlin. Dated 1888.
Figure 5 – 1888: persons at a groundwater well in front of the water supply plant in Berlin.
Berlin water supply drawing identifying locations of wells and water supply plant.
Figure 6 – Map of Shoemaker Pond with locations of groundwater wells and water supply plant.

“If the present popularity of meters continues it will not be long till all services are metered and it is my opinion that the sooner this time arrives the better for all concerned. It is not probable that the water supply of Berlin will ever be so abundant that reckless wastes can be permitted and I know of no means of checking this more effectually than by the general use of water meters.”

Wm. Mahlon Davis, Superintendent, 1st Annual Report of the Water Commissioners of the town of Berlin, 1899.

On May 19, 1899, the Berlin Water Commission begins work to move away from supplying Berlin with water from Shoemaker Pond by drilling wells to extract groundwater (that’s me!). Throughout the year, 10 wells are constructed with the capacity to provide the community with about 4.5 million litres of water each day.

Photo of persons drilling a well near Shoemaker Pond, Berlin in 1899.
Figure 7 – 1899: persons drilling a groundwater well near Shoemaker Pond in Berlin.

“It is a water of remarkable purity, and in hardness even as low. I congratulate the town in the supply it has secured.”

John J. Mackenzie, Bacteriologist Office of Provincial Board of Health, 1899, regarding the new wells drilled for the town of Berlin.

In 1911, the first prohibition on lawn watering is enforced in Berlin supported by the hard working, frugal nature of Berlin residents who value the importance of conserving water.

“Any scheme that prevents reckless waste of water and at the same time reduces the volume of sewage as this should be encouraged.”

Wm. Mahlon Davis, Superintendent, 3rd Annual Report of the Water Commissioners of the town of Berlin, 1901.

In 1912 a pump house – to help move groundwater once extracted from the wells through the distribution system – is built where the Greenbrook Treatment Plant now stands. Over the years, this building has expanded to included improved treatment processes.

Drawing of the Greenbrook Water Treatment Plant and reservoirs with timelines when sections were built.
Figure 9 – Construction timeline for Greenbrook Water Treatment Plant and reservoirs. See below for legend.
Number on mapYear builtDescription
11914underground raw water reservoir
21930diesel house; now administrative area
31937underground drinking water reservoir
41959administrative area
51959pump room (replaces 1912 pump house and 1916 filter building)
61990iron and manganese filter room
72010advanced oxidation process treatment room
City of Kitchener Heritage Landmark plaque.
Figure 8 – In 1998, the Greenbrook Water Treatment Plant was designated as a heritage building for its importance in the early years of public service, and its Romanesque revival architecture in the 1930, 1959 and 1990 additions.
Section of Greenbrook Water Treatment Plant built in 1930.
Figure 10 – Section of Greenbrook Water Treatment Plant built in 1930.

Berlin is now Kitchener with a population of more than 230,000. The 10 wells drilled in 1899 are no longer operational. There are five supply wells we use today. The wells were drilled in 1986 to 2015 and range in depth from 32 to 50 metres extracting groundwater from a sand and gravel aquifer.

Entrance to Greenbrook Water Treatment Plant.
Figure 11 – Greenbrook Water Treatment Plant.

Today, five supply wells, many monitoring wells, two reservoirs and a treatment plant make up the Greenbrook wellfield. The wellfield provides 8 per cent of the drinking water for Kitchener – about 6.5 million litres – enough to fill 130 backyard swimming pools every day.

  • Historical timeline:

    1854 – Berlin incorporated.

    1888 – American firm forms the Berlin Waterworks Company and begins pumping at Shoemaker Pond.

    1889 – Town of Waterloo signs 10-year contract with Berlin Waterworks Company to supply water.

    1896 – A major factory fire in Berlin causes a change in community acceptance of public water supply systems.

    1898 – Town of Berlin buys Berlin Waterworks Company for $102,000.

    1899 – Berlin Commission forms and constructs the first well near Shoemaker Pond.

    1911 – First ban on lawn watering in Berlin and Preston due to water shortages.

    1914 to 1919 – World War I slows expansion of municipal waterworks due to lack of labour and materials.

    1916 – Berlin changes its name to Kitchener.

    1927 – 3.8 million litre capacity water tower built on George Street in Kitchener (2011: decommissioned).

    1930 – Municipal water supplies are solely from groundwater wells.

    1931 to 1934 – Government work programs during the Depression aid growth of water pipe network.

    1939 to 1945 – World War II causes rising industrial water use, straining municipal supplies.

    1953 – Mannheim wells begin supplying Kitchener with 20 per cent of water supply. This lessens demand for water from the Greenbrook wells.

    1955 – Ontario Water Resources Commission established. Kitchener is one of 14 municipalities represented.

    1965 – Waterloo County Planning Area established.

    1973 – Regional Municipality of Waterloo forms and assumes responsibility for municipal drinking water supply.

    1974 – First watermain swabbing used to clean watermain pipes.

    1992 – The Mannheim Water Treatment Plant begins purifying surface water from Grand River for municipal water supply.

    1993 – 6.8 million litre capacity water tower at a height of 50.77 metres is built on Sportsworld Drive in Kitchener.

    1998 – City of Kitchener designates the Greenbrook Treatment Plant as a heritage building for its importance in the early years of public service, and its Romanesque revival architecture in the 1930, 1959 and 1990 additions.

In 1888 Berlin Waterworks Company built a water pumping station in Berlin (now Kitchener) to supply water from Shoemaker pond. Today 5 groundwater wells at the Greenbrook Water Treatment Plant supply Kitchener with water. #WRhistory #Iamgroundwaterblog

Related posts:

A look back in time – Waterloo’s first drinking water system

In my last post I shared the story of Kitchener’s first drinking water system. Today I’d like to share Waterloo’s.

It’s the late 1800s. The Town of Waterloo – with a population of less than 3000 – is in need of a water system and must make the decision of how to supply water to the community. Waterloo voters reject a proposal of municipal ownership of the water works – a new idea at the time.

In 1889 the town signs a 10-year contract with Waterloo Water Works – a private company – to supply water to the community. The Waterloo Water Works company hires the Berlin Waterworks company to supply Waterloo with water.

From 1889 to 1899, the municipal water supply for Waterloo is piped from Shoemaker Pond in Berlin (now Lakeside Park in Kitchener). This water is not always of good quality, to say the least.

In April 1899, the poor quality of the water supply influences the passing of a bylaw for a municipal water works. This prompts the construction of the William Street Pumping Station and three drinking water wells funded through a debenture of $40,000. A small, open reservoir connected to the three underground reservoirs handles any overflow. The open reservoir also served as a decorative feature and often included fish.

plaque commemorating the formation of the Water Commission and construction of the William Street pumping station in 1899.
Figure 1 – Plaque commemorating the formation of the Water Commission and construction of the William Street Pumping Station in 1899.

The wells that operate today were constructed in the 1940s and 1950s. They are about 35 metres deep and extract groundwater from a sand and gravel aquifer which is at the edge of the Waterloo Moraine. One reservoir with a 2.3 million litre capacity is located on the north end of the property.

William Street Pumping Station near King Street and across from Waterloo City Hall.
Figure 2 – William Street Pumping Station near King Street and across from Waterloo City Hall.
Waterloo Public Utilities Commission and town officials tapping an artesian well on Caroline Street, 1919.
Figure 3 – Waterloo Public Utilities Commission and town officials tapping an artesian well on Caroline Street, 1919.

The William Street property is shared with Waterloo North Hydro. In 1910, the town’s Water Commission became the Water and Light Commission and in 1928, became the Public Utilities Commission. Unlike the water utility, the power utility was later privatized as Waterloo North Hydro.

During the early days of the Water Commission, the chief operator lived in one of the homes behind the William Street Pumping Station. The operator had to live nearby in order to be available to fix problems and to keep the pumping station operational.

A diesel generator fuelled with coal was used to power the pumping station and also was a backup source of power for the nearby Waterloo Threshing plant. After electricity was connected, the diesel generator was used as an emergency backup power source. The last time the generator was used was July 1989. The generator and a wall board with the custom tools once used to maintain the generator and other machines still exists.

Figure 4 – Diesel generator once used to run the William Street Pumping Station.

Tools used to maintain the diesel generator.
Figure 5 – A wall board with the tools once used to maintain the diesel generator.

The coal required to run the generator was delivered through a chute door located next to the main door of the pumping station.

Chute door used to deliver coal to run the diesel generator.
Figure 6 – Chute door once used to deliver coal for the diesel generator.
Scales used to weigh coal required to run the diesel generator.
Figure 7 – Scales once used to weigh coal for the diesel generator.
  • Historical timeline:

    1876 – Waterloo incorporated.

    1889 – Town of Waterloo signs 10-year contract with Berlin Waterworks to supply water.

    1899 – Waterloo buys part of waterworks system from Berlin Waterworks Company and builds the William Street pumping station and 3 wells at a cost of $40,000.

    1914 to 1919 – World War I slows expansion of municipal waterworks due to lack of labour and materials.

    1928 – Waterloo replaces Water & Light Commission with Waterloo Public Utilities Commission.

    1930 – Municipal water supplies are solely from groundwater wells.

    1931 to 1934 – Government work programs during the Depression aid growth of water pipe network.

    1939 to 1945 – World War II causes rising industrial water use, straining municipal supplies.

    1950 to 1956 – Waterloo is the fastest growing city in Canada with a population increase of 35.7%.

    1965 – Waterloo County Planning Area established.

    1966 – Fluoridation is introduced to water in Waterloo to promote dental health (discontinued in 2010 following referendum vote).

    1973 – Regional Municipality of Waterloo forms and assumes responsibility for municipal drinking water supply.

    1974 – First watermain swabbing used to clean watermain pipes.

    1987 – 27 million litre capacity water tower at a height of 25 metres is built on Conservation Drive in Waterloo.

    1989 – City of Waterloo designates William Street Pumping Station as a heritage building for its historic and architectural value.

    1992 – The Mannheim Water Treatment Plan begins purifying surface water from the Grand River for the municipal water supply.

    2013 – 7.2 million litre capacity water tower at a height of 41 metres is built near Ira Needles Boulevard in Waterloo.

In 1899 the Town of Waterloo Water Commission built the William Street Pumping Station and three wells. Prior to that, Berlin (now Kitchener) supplied water to Waterloo from a pond. #WRhistory #iamgroundwaterblog

Related posts:

A look back in time – Cambridge’s first drinking water system

My last few posts have been about Kitchener’s first drinking water system and Waterloo’s first drinking water system. Today I’d like to share Cambridge’s story.

Galt (now part of Cambridge) was the first community in Waterloo Region to have a publicity owned waterworks. Galt – like many communities – wanted a waterworks for fire protection, but also to compete with nearby Berlin (now Kitchener) for industry and residents.

The year is 1888 and after much debate in the community, Galt votes down – 2 to 1 – having a public waterworks. However, in 1890 a bylaw is passed and a construction contract signed to build a water pumping station on Middleton Street.

Middleton Water Pumping Station at 60 Middleton Street in Cambridge.
Figure 1 – Middleton Water Pumping Station, 60 Middleton Street, Cambridge.

Even though Middleton Water Pumping Station is built along the Grand River, the river is not an option for a water source. The river has very low flow sometimes because control dams have not yet been constructed to control water levels. Water quality for the Grand River is also poor due to contamination from industrial discharges including dyes from nearby garment factories.

So instead of accessing water from the Grand River, water is redirected from nearby springs. In 1895, the source switches to groundwater when the first well is drilled and constructed. The following year in 1896 a second well is built. Today, there are still operating wells in the same location, and it is very likely that they are the same wells; open holes drilled into the deeper fractured rock and sealed through the shallow rock to protect the deeper water quality.

In 1902, the long low section of the Middleton Water Pumping Station is the reservoir. This reservoir has since been removed but the north wall of the pumping station still shows the marks of the building.

Low section of the Middleton Water Pumping Station where reservoir was located.
Figure 2 – Low section of the Middleton Water Pumping Station where reservoir was located.
Two people looking at wood reservoir inside the Middleton Water Pumping Station.
Figure 3 – Wood reservoir at the Middleton Water Pumping Station.

In 1973, when Galt, Hespeler and Preston amalgamate to form Cambridge, the water works, including the Middleton Water Pumping Station, become the responsibility of the Regional Municipality of Waterloo.

In 1996, a new facility is built on the same five-acre lot to expand the capacity of the system to handle 20 million litres of water a day – six times the capacity of the original water works.

Today, all the water pumped at the Middleton Water Pumping Station is from five groundwater wells.

Middleton Water Pumping Station dedication plaque.
Figure 4 – Middleton Water Pumping Station dedication plaque. Look closely – can you spot the spelling mistake?
Galt Water Works sewer cover, 1891.
Figure 5 – Galt Water Works sewer cover, 1891.
Original fountain from Waterworks Park built in 1898.
Figure 6 – Original fountain from Waterworks Park built in 1898.
Figure 7 – Motor and pump inside the Middleton Water Pumping Station. Move the slider between the photos to compare the photo on left taken in the 1950s and the photo on the right from 2012.
Pump inside the Middleton Water Pumping Station, 1950s.
Figure 8 – Pump inside the Middleton Water Pumping Station, 1950s.
  • Historical timeline:

    1850 – Galt incorporated.

    1852 – Preston incorporated.

    1859 – Hespeler incorporated.

    1890 – Galt forms public water utility.

    1890 – Middleton Water Pumping Station is built.

    1891 – 977,000 litre capacity water tower at the height of 15 metres is built on St. Andrews Street in Galt. (2017: decommissioned)

    1901 – all Galt services are metered to monitor water consumption.

    1907 – Preston and Elmira start municipal waterworks.

    1911 – First ban on lawn watering in Berlin and Preston due to water shortages.

    1914 to 1919 – World War I slows expansion of municipal waterworks due to lack of labour and materials.

    1915 – Hespeler passes bylaw for municipal waterworks.

    1919 – Galt Public Utilities Commission promotes water conservation campaign.

    1920 – Preston water services all billed meters.

    1930 – Municipal water supplies area solely from groundwater wells.

    1931 – Preston experiences water shortages; disconnects drinking water fountains and turns off water to horse troughs and obtains water from Galt.

    1931 to 1934 – Government work programs during the Depression aid growth of water pipe network.

    1939 to 1945 – World War II causes rising industrial water use, straining municipal supplies.

    1949 – 3.4 million litre capacity water tower at a height of 18 metres is built on St. Andrews Street in Galt.

    1950 – Preston Public Utilities Commission is formed.

    1965 – Waterloo County Planning Area established.

    1972 – 3.4 million litre capacity water tower at a height of 27 metres is built on Edward Street by Harvey Lane in Hespeler (1982: decommissioned).

    1973 – Galt, Hespeler and Preston amalgamate to form Cambridge.

    1973 – Region Municipality of Waterloo forms and assumes responsibility for the municipal drinking water supply.

    1974 – First watermain swabbing is used to clean watermain pipes.

    1974 – 2.2 million litre capacity water tower at a height of 34 metres is built on Preston Parkway in Cambridge (2009: decommissioned).

    1978 – 2.2 million litre capacity water tower at a height of 32 metres is built on Dalkeith Drive in Cambridge.

    1982 – 17 million litre capacity water tower at a height of 34 metres is built on Pinebush Road in Cambridge.

    1992 – The Mannheim Water Treatment Plant begins purifying surface water from the Grand River for the municipal water supply.

    1997 – City of Cambridge designates the Middleton Water Pumping Station as a heritage building for its architectural and historic value.

In 1890 the Galt Water Works began construction on the first water pumping station in Galt (now part of Cambridge) to supply water from a spring. Still in operation, the Middleton Pumping Station houses five wells. #WRhistory #iamgroundwaterblog

Related posts:

Maps aren’t just for roads

Maps are great tools. They can help you find where you are, provide information on nearby landmarks and help guide you to your final destination. Remember the good ole days of paper maps? Now-a-days I’m guessing many of you use a GPS or an APP on your phone to help you get around.

For me – groundwater, I don’t really need a map. Partly because it would be really hard to read down here in the aquifer but mostly because I honestly don’t care where I am or where I end up. For me, there are no borders or boundaries thanks in part to the water cycle.

However, my friends at the Region of Waterloo seem to think otherwise. They like to track my every movement – where I soak into the ground, how long I’m underground and the different paths I take to reach the 120+ municipal supply wells in Waterloo Region.

Each municipal supply well is in a Wellhead Protection Area made up of four zones: 100-metres, 2 years, 5 years and 25 years. The 100-metre zone is the closest to the supply well, with the remaining zones marking the time it takes for me to reach the well.

illustration shows time of travel for groundwater from different points underground to the well. Image credit: Conservation Ontario.
Wellhead Protection Areas surround each municipal supply well in Waterloo Region
Image credit: Conservation Ontario

Understanding the geology of the land

With the help of computer modeling, hydrogeologists can track my movement and use this information to create Wellhead Protection Area maps.

To understand how I move underground you first need to know what materials I’m moving through. Aquifers, where you can find me, are made of different layers of materials such as sand, gravel, clay and bedrock. No two aquifers are the same. The layers in one aquifer can be very different from another. And in fact, the types of materials and how they are layered can change in a single aquifer.

As I slowly move through the spaces between these materials I travel at different rates of speed. Sand is like a sponge, slowing me down as well as acting as a natural filter. Rocks and gravel with larger spaces or cracks provide me with more room so I can travel at a quicker pace compared to sand. Clay is like a big ole stop sign for me. Its hard-packed and dense material acts as a barrier forcing me to change my route.

map showing wellhead protection areas for municipal wells in Waterloo Region.
Wellhead Protection Area map for Waterloo Region. Area in red is closest to the supply well.

Why Wellhead Protection Area maps are important

One reason Wellhead Protection Areas are important is they help bring attention to me. When you look around it’s easy to see the lakes and streams. But I hide underground so I don’t always get the attention I deserve. You know the saying – out of sight – out of mind.

The maps help make groundwater real and hopefully more valued. They provide important information on my whereabouts and the journey I take to each municipal supply well.

And finally, the Wellhead Protection Area maps are an important groundwater protection tool supporting actions using the Source Water Protection Plan to reduce risks from pollution to groundwater.

And as the official drinking water for Waterloo Region, I’d like to think I’m worth protecting.

Cheers, Groundwater

Wellhead Protection Area maps show how groundwater moves to each of the @RegionWaterloo 120 supply wells. An important Source Protection tool for reducing risks of pollutants to groundwater. #iamgroundwaterblog

Related posts:

Is salt really that bad for water?

More and more, salt is becoming a normal part of the winter landscape. As one of the many tools used to clear snow and ice, salt is spread over most surfaces where you walk, bike, drive and park your vehicle. That’s a lot of area covered in salt!

over-salted stairs
Figure 1 – Salt is not just for the roads. Over salting on stairs.

You might not think of salt as a pollutant. However, TVO’s article Oversalted: Why Ontario needs a new approach to snow removal states “Environment Canada completed a five-year study in 2001 that concluded road salt should be added to its list of toxic substances, although the department did not actually ban the use of road salt.”

Keeping everyone safe and protecting the environment can be a tough balancing act. But using too much salt or when not needed isn’t good for plants, pets’ paws, cars, and buildings. If you have read my blog “The hidden costs of winter salt and ice melter you might not know about” you’ll know what I mean.

But what about fresh water in lakes and streams and me – groundwater? Is salt really that bad for water? Doesn’t salt just go away after it melts the ice and if not, can’t technology be used to simply remove the salt from water?

Stream in Waterloo Park in winter.
Figure 2 – Salt is damaging to fresh water including groundwater.

Did you know?

  1. Salt is a long-term pollutant that stays with water. Once salt is spread on the ground it stays in the environment. You might not see the salt anymore after the snow melts or when the salt is washed away with the rain but it’s still there. The salt can soak into the ground to mix with me and will build up over time or enter a local waterway through a storm drain.
  2. Water and wastewater treatment does not remove salt from water. Removing salt requires desalination which is extremely expensive and energy intensive, and greatly increases greenhouse gases. Including desalination as part of the treatment process would also result in much higher water costs for the community.
  3. When talking about water pollution, it’s the chloride in the salt and ice melter products that’s the problem. This includes environmentally-friendly products. Basically, if it melts the ice it most likely contains chloride and is damaging to water.

Salt impacts the taste of drinking water

For drinking water, it’s all about the taste. The Ontario Drinking Water Objectives for chloride is 250mg/L. This is when a salty taste may be detectable by some people.

Video: snow and ice clearing tips

The maps below compare the chloride levels from 1998 and 2018 at the Region of Waterloo drinking water supply wells. The orange and red dots are groundwater wells with chloride levels near or exceeding the 250 mg/L limit. Currently, the Region of Waterloo must mix groundwater from different wells to lower the chloride levels.

water quality map comparing chloride levels in Region of Waterloo municipal wells between 1998 and 2018.
Figure 3: Water quality map comparing chloride levels in Region of Waterloo municipal wells between 1998 and 2018.

Salt is harmful to aquatic life

The Canadian Water Quality Guideline states for the protection of aquatic life that the long term exposure of chloride levels for freshwater should be below 120 mg/L.

Did you know a dragonfly eats hundreds of mosquitoes every day? Unfortunately, a salty pond can impact their numbers. A CBC article Salty dragonflies mean more mosquitoes, researchers reported in a study on how increased salt levels in a pond had little affect on mosquito larvae but were impacting dragonfly larvae.

Non-native or invasive species can also begin taking over areas meant for native wildlife. The price of salt: How road salts are affecting our Great Lakes written by Lake Ontario WaterKeeper shares how “Spots in Ontario have become so salty that there have been sightings of saltwater animals in the freshwater creeks. Reports of saltwater blue crabs living in Mimico Creek is just one troubling case that illustrates the extent of sodium chloride pollution in watersheds of Lake Ontario.”

Increasing salt levels in surface water is not limited to the GTA. The Grand River Conservation Authority measures water conductivity in the watershed. Although conductivity data does not measure chloride levels, it is an indicator that chloride is likely present.

Protecting water from salt pollution is a complex issue. It might not be realistic to stop salting completely; however, there are actions everyone can take to use less.

Salt is a normal part of the winter landscape. Salt is spread over most surfaces where you walk, bike, drive and park your vehicle. So is it really that bad for water? Read the I Am Groundwater blog to find out. #iamgroundwaterblog

Related posts:

Balancing winter road safety with the environmental impacts of salt and ice melters

When asked where salt is spread, many people will probably say roads. It’s true; levels of service requirements in Ontario make salt the prime tool in keeping roads safe. However, a lot of salt is also spread on parking lots, sidewalks and community trails. Unfortunately, because salt isn’t regulated and can be bought and used by anyone, the data for how much salt is spread on surfaces other than roads is not easy to get or reliable. Compared to roads, the application rate (how much salt spread in a measured area) for parking lots and walkways is thought to be two to three times greater. This is where we have the most opportunity to reduce chloride application.

snowplow on rural road plowing snow off road
Figure 1 – A Region of Waterloo snowplow in action. (photo credit: Donald Graham)

There are many reasons for potential over salting of parking lots and walkways that include lack of maintenance standards, outdated technology, and liability concerns. Municipal snowplow operators who clear the roads must participate in winter maintenance training that includes salt management principals and have access to resources and current technologies related to winter operations to maintain winter roads in the most efficient way possible.

Here are just some of the ways municipalities are better managing salt use while keeping roads safer for your community:

  • Snowplow operators receive training on how weather events can affect road surfaces and best management practices for salt
  • Road and atmospheric weather sensors provide operations staff monitoring road conditions with data to determine the appropriate course of action
Advanced Road Weather Information System (ARWIS) collects information on pavement and air temperatures.
Figure 2 – Advanced Road Weather Information System (ARWIS): one of three weather stations the Region of Waterloo uses to collect information on pavement and air temperatures.
  • Depending on weather and road conditions, some of the materials used may include:
    • Direct Liquid Application. This involves spraying a salt liquid on the road prior to a winter storm – referred to as anti-icing – to prevent ice and frost from forming and bonding to the pavement. Anti-icing uses less salt and increases the effectiveness of plowing early in the storm.
    • Pre-wetted salt. This is dry road salt with liquid salt brine applied on the dry salt before it is spread on the road. This helps the salt stick to the road surface and speeds up the effectiveness of the salt to form a salt brine solution on the pavement.
    • Sand. Can be used on its own or in combination with salt to provide traction when salt is less effective when temperatures fall below -12 degrees Celsius.

Salt brine is a mixture of water and a salt such as sodium chloride, magnesium chloride or calcium chloride. The type of salt used determines the working temperature of the brine.

  • Snowplows are equipped with:
    • Electronic spreader controls. Predetermined application rates ensure the correct amount of material is applied by the operator who selects rate of salt or sand based on the road and weather conditions.
    • Infrared thermometers. Provides continuous, accurate road and air temperature readings to assist the operator in the effective use of salt.
    • Global Positioning System. Records the location of the snow plows and amount of salt applied. Operations staff can review the information to minimize the application of salt while achieving the required level of service.
    • Blade technology. Snow plow blades follow the contours of the road to allow for the maximum amount of snow and ice to be removed mechanically thus reducing the amount of salt required.
  • Enclosed storage areas keep salt contained from outside exposure protecting the natural environment.
Salt storage facility at the Region of Waterloo Operations Centre.
Figure 3 – Salt storage facility at the Region of Waterloo Operations Centre. (photo credit: Donald Graham)
  • Snow fences in strategic locations and establishing new hedgerows help reduce snow drifting on to roads, which generally leads to the need for less salt.
snow fence placed by roads.
Figure 4 – Strategically placed fencing helps to reduce snow blowing on to roads that can create icy surfaces.
snowplow
Figure 5 – Parts of a snowplow.

Parts of a snowplow:

  • Snow plow blade (front) – Mechanically removes snow and ice from the road reducing the amount of salt that is required to treat the road.
  • Snow plow blade (wing plow) – moves snow to the side of the road.
  • Conveyor – moves the salt from the hopper to the chute.
  • Tank – holds the pre wetting liquid to be sprayed on the salt.
  • Hopper – holds large amounts of salt the snow plow uses.
  • Liquid nozzle – sprays pre-wetting liquid on the salt as the salt travels along the conveyor. The liquid helps the salt work faster to form a brine requiring less salt to be applied on the road.
  • Chute – directs the salt from the conveyor to the spinner.
  • Spinner – controls the width of material that is being placed on the road.
  • Temperature display – shows the air and pavement temperatures so the snow plow driver knows when salt will work best.
  • Material application controller – allows the snow plow driver to control the amount of salt spread on the road.
  • Plow controller – allows the snow plow driver to move the front and wing plows.

How can you help?

  • Switch to winter tires
  • Drive for the weather conditions and give yourself extra time to arrive at your destination
  • Respect winter plowing operations. Operators are out to make the roads safe. Avoid passing a snow plow and show courtesy to the job they are doing.
  • When possible, consider leaving your car at home and taking public transit
Video: Winter tires quiz
Video: Top 10 tips to prep for winter driving
Video: A shift in the life of a snowplow driver

Safe travels, Groundwater

Have you ever wondered what’s involved with clearing snow and ice from roads? Snowplows are not just a truck with a plow. Read this I Am Groundwater blog to learn about the technology and equipment onboard. #iamgroundwaterblog

Related posts:

Five actions your business can take to reduce slip and fall hazards this winter

I get it. Safety is top of mind. And in the winter, keeping your business clear of snow and ice is no easy task. So what do you reach for? I’m going to say salt or some sort of ice melting product. Along with the cost to purchase salt there are other costs you might not consider. My post “The hidden costs of salt and ice melter you might not know about” talks about just that.

Protecting the environment including me – your drinking water – is important but I’m guessing someone slipping and falling on your property is a more pressing concern.

What if I told you there are actions you can take to reduce icy areas? Reducing icy areas can mean less salt on the ground – which is a good thing for me – and allows you to better manage your risk from a slip and fall.

Video: Winter maintenance – preventing ice before it occurs (Region of Waterloo)

So what can you do?

Start with a complete winter maintenance plan. Being proactive instead of reactive prepares your team for whatever Mother Nature might throw at them.

Walk your property on a rainy day. Watch how the rain flows, pools or puddles on your property. This same water in the warmer months can turn to ice when the temperature drops. In other words, potential slip and fall hazards needing more salt to deal with the ice.

illustration of person with umbrella with the word winter underneath
Figure 1 – Rain in the warmer months can become an icy slip and fall hazard in the winter.

Here are my top five actions you can take to better manage icy areas and provide safer passage for your staff and visitors.

  1. Repair leaky eaves troughs and downspouts. Leaky eaves troughs and downspouts can drip water on to paved walking areas that can turn into black ice, hard to see but easy to slip on. While taking that walk on a rainy day remember to look up for drips and leaks that can freeze into ice on a walkway.
rain dripping from an eaves trough
Figure 2 – Drippy eaves troughs can create icy areas where your staff and visitors walk.

2. Redirect downspouts away from paved areas. Downspouts draining on to paved areas can create icy areas that are hard to manage. Is it possible to move those downspouts so the water soaks into a grassy or landscaped area instead? Can you add an extension that takes that water to exit at a porous surface?

rain from downspout draining on to parking lot
Figure 3 – Where does the water from your downspout go?

3. Close areas instead of salting. Closing areas not needed in the winter can reduce your risk from potential slip and fall hazards. As part of your winter preparations, identify areas you can close without impeding emergency exits, accessibility ramps or entrances. Areas to close may include outdoor patios, overflow parking, redundant walkways or stairs. During, the pandemic, there may be larger areas of your parking surface that can be closed and don’t need to be maintained.

3 sets of stairs with two sets closed off.
Figure 4 – Areas to close might include redundant stairs.

4. Stop snow from drifting on to paved areas. Landscaping or snow fences can help keep drifting snow off paved areas and reduce icy areas from forming due to wind. Consider wind direction and elevation changes when choosing locations.

hedge behind parking lot
Figure 5 – Landscapes and fencing can help stop snow from drifting on to your property.

5. Store your snow where it won’t melt across paved areas. Where will you put the snow after it’s plowed? Store snow on paved surfaces on the lowest area of the property near a catch basin to stop melted snow from refreezing across your parking lot.

snow pile melting across parking lot
Figure 6 – Where you store the snow can help reduce ice from forming across your parking lot.

Now you know my five actions you can take to deal with the ice that can lead to slips and falls. Ready to take that walk? Make sure to grab your umbrella and this winter maintenance worksheet and map template to help you document those trouble spots.

Is your business winter-ready? Walk your property on a rainy day to see how rain flows and puddles. When temps drop this same rain turns to ice. Managing stormwater can reduce slip and fall hazards. #iamgroundwaterblog

What to do with your leftover salt at the end of the season

You’ve done your best to clear the snow and ice while limiting the use of salt. But with winter over, what should you do with any salt that’s leftover?

In this week’s blog’s post, we’ll talk about:

  • What is the expiration date for salt?
  • How should salt be stored after winter?
  • How do you dispose of salt?
  • Can you use salt for anything else?

Does salt expire?

Rock salt, like other types of salt such as table and kosher, does not have a set expiration date. Because salt – sodium chloride – is an essential mineral, it can never spoil. This is the reason salt has been used as a food preservative and seasoning for thousands of years. If stored properly, salt can last indefinitely. So there is no need to use it all up before the end of the winter season.

How to store salt until the next season?

Salt should be stored in a cool and dry place with few temperature changes. Keep your winter salt in an airtight container, as changes in moisture can cause your salt to clump together and harden. If the salt does end up clumping together, you can still use it by breaking it apart.

Wherever you store it, make sure to keep it out of the reach of children and pets. Winter salt and ice melter can be harmful if ingested, can irritate mouths and stomachs and, depending on the amount consumed, winter salt can be poisonous.

Sweep up your salt at the end of winter

Instead of buying more salt, save your money by sweeping up any leftover salt to use again next winter! Don’t forget about any excess salt that has collected in driveway corners, steps, or walkways. Leaving it there for the rain to wash away adds to salt’s negative effects on your own gardens, buildings, other plant life nearby, and your drinking water (that’s me!).

How to handle and dispose of salt

Since salt doesn’t expire, consider keeping it for next year or donating it to a not-for-profit organization or place of worship.

When handling winter salt, use a scoop and wear a pair of protective gloves if your skin will make contact with the salt. Handling salt can lead to “salt burns”, mild rashes or skin irritations. This also helps demonstrate just how corrosive salt is.

What not to do with winter salt

What you shouldn’t do is throw it out or pour it down a storm drain where it can impact the local environment. Even after the rain has washed salt away and you can’t see it any more, it never really goes away. The salt can wash into a creek or stream or soak into the ground to mix with me – groundwater, your drinking water; changing fresh water to salty water.

Salt poured down a storm drain that connects with the local water system.
Never pour salt down a storm drain

Never use salt as a week killer. Salt is bad for the environment. Salt robs soil of its moisture, creating a toxic environment for plant life. It is so effective at killing plant life that sometimes people will suggest it as a weed killer. This may kill your weeds, but the salt will also harm any other plants nearby and when it rains the excess salt can end up mixing with me or my cousins in streams or creeks. Caution should be used when spreading salt around plants in the winter as it can have lasting effects on plant life in the spring and summer months that follow.

What about water softener salt?

Never replace your water softener salt with salt meant for melting ice. Water softener salt, as opposed to winter salt, is specifically processed to be used in water softening equipment. Winter salt is unprocessed and sold with all of the impurities it brought with it from the ground. This may make it cheaper than softener salt, but winter salt has 95% purity, whereas softener salt has 99% purity. This difference in purity may not seem significant, but using winter salt as a softener for your water will only hurt your wallet in the end. Winter salt’s drop in purity means that it contains several insoluble minerals, like clay and shale. These minerals can clog your pipes, resulting in more frequent maintenance and repairs.

Save your salt for what it was meant to do – breaking down ice during winter months.

Winter salt can last indefinitely and can be kept until next season when stored properly throughout the year. Saving your winter salt for the following year reduces excessive waste and helps your wallet once winter rolls around again.

Winter’s over. You’ve put away the snow blower, shovel and ice chopper. But what should you do with any salt that’s leftover? #iamgroundwaterblog #SaltingShift

5 questions you should ask yourself before salting

I know I like to go on and on about this but this time of year it’s really top of mind for me. And when I say top I literally mean top. I’m talking about salt and ice melter. The salt or ice melter put on the ground is on top of me. Once the salt is done its job of melting the ice it doesn’t go away. It can end up mixing with me and over time this will make me taste salty.

Help keep salt out of me. Ask yourself these five questions before salting.

  1. What’s the temperature? Alright, it’s cold. But how cold is it exactly? The current local temperature matters quite a bit when using your salt or de-icer. Salt and de-icers work at different temperatures. It’s important to read the directions on the product packaging so you know what temperature the product you are using works best. For example, sodium chloride salt loses its effectiveness on ice when the surface temperature dips below minus 10 degrees Celsius. Sprinkling salt on an extremely cold day won’t get rid of your ice, and it will increase the risk of salt damage. Break up the ice with a steel ice chopper and use sand, grit or non-clumping kitty litter to create traction instead.
outdoor thermometer
  1. What will the temperature be in the coming hours? Check your upcoming weather conditions before adding unnecessary salt. Is the forecast predicting warmer weather in the very near future, potentially rising above freezing? In that case, there’s little reason to use salt at all. If temperatures are on the rise, let the sun do the work for you by melting the ice without the environmental damages from salt. While waiting for the sun to do its job, spread a traction aid like sand to reduce the risk of slips and falls. Once the sun has started to soften the ice, a steel ice chopper can also help break up the ice, followed by clearing it with a shovel.
illustration of weather patterns
  1. Are there plants nearby? How close is the salt to your grass, or plants? This is an important thing to take note of, as salt can dehydrate soil and block a plant’s ability to feed itself. Be sure to use salt sparingly around plants, keeping both as far away from each other as possible. When you need to use salt, do your best to aim with accuracy so that none of it ends up on grassy areas or in plant beds – besides the environmental impacts, it’s also a waste of salt.
Salt can damage landscapes.
  1. Where are your pets? If you have pets that go outside, remember that salt can hurt their paws, and should never be consumed. Although your loyal friend may want to help you clear your driveway, make sure they are not nearby if you need to apply salt. Following the label directions, and not over salting, will help you reduce the chances of salt irritating your pets in the future.
Salt can hurt a pet's paws.
  1. How much salt should I use? This is an important question that should be asked more often. First, make sure you read the packaging label to see what’s recommended. Fact is, the majority of people over-apply salt by a large margin. Although you might think the more salt the better, too much salt creates other problems including affecting me – your drinking water. Spread a thin layer of salt evenly across any icy areas. In many cases, a few tablespoons of salt for a one-metre square area of ice – about the size of a sidewalk slab – is all you need to get the job done. Using a salt with a finer grain will also help you to spread it more evenly so it can work faster. Also, if after the ice is gone and you still have salt, sweep it up to save for another time.
In many cases, only a few tablespoons of salt for a one metre square area is all you need.

It’s sometimes just old habit to reach for a bag of salt before considering other environmental factors. Not only will over salting cost you more in salt, but poor practices also negatively impact many aspects of your lives, from your environment to your infrastructure.

How do you make the call on when to salt or when not to?

Once salt is done its job of melting the ice it doesn’t go away. It can end up mixing with groundwater – your drinking water. 5 questions you should ask yourself before salting. #iamgroundwaterblog #SaltingShift